- Location
- Zoom
- Series/Type
- CANUE Event, DLSPH Event
- Format
- Online
- Dates
- April 28, 2023 from 1:00pm to 4:00pm
Links
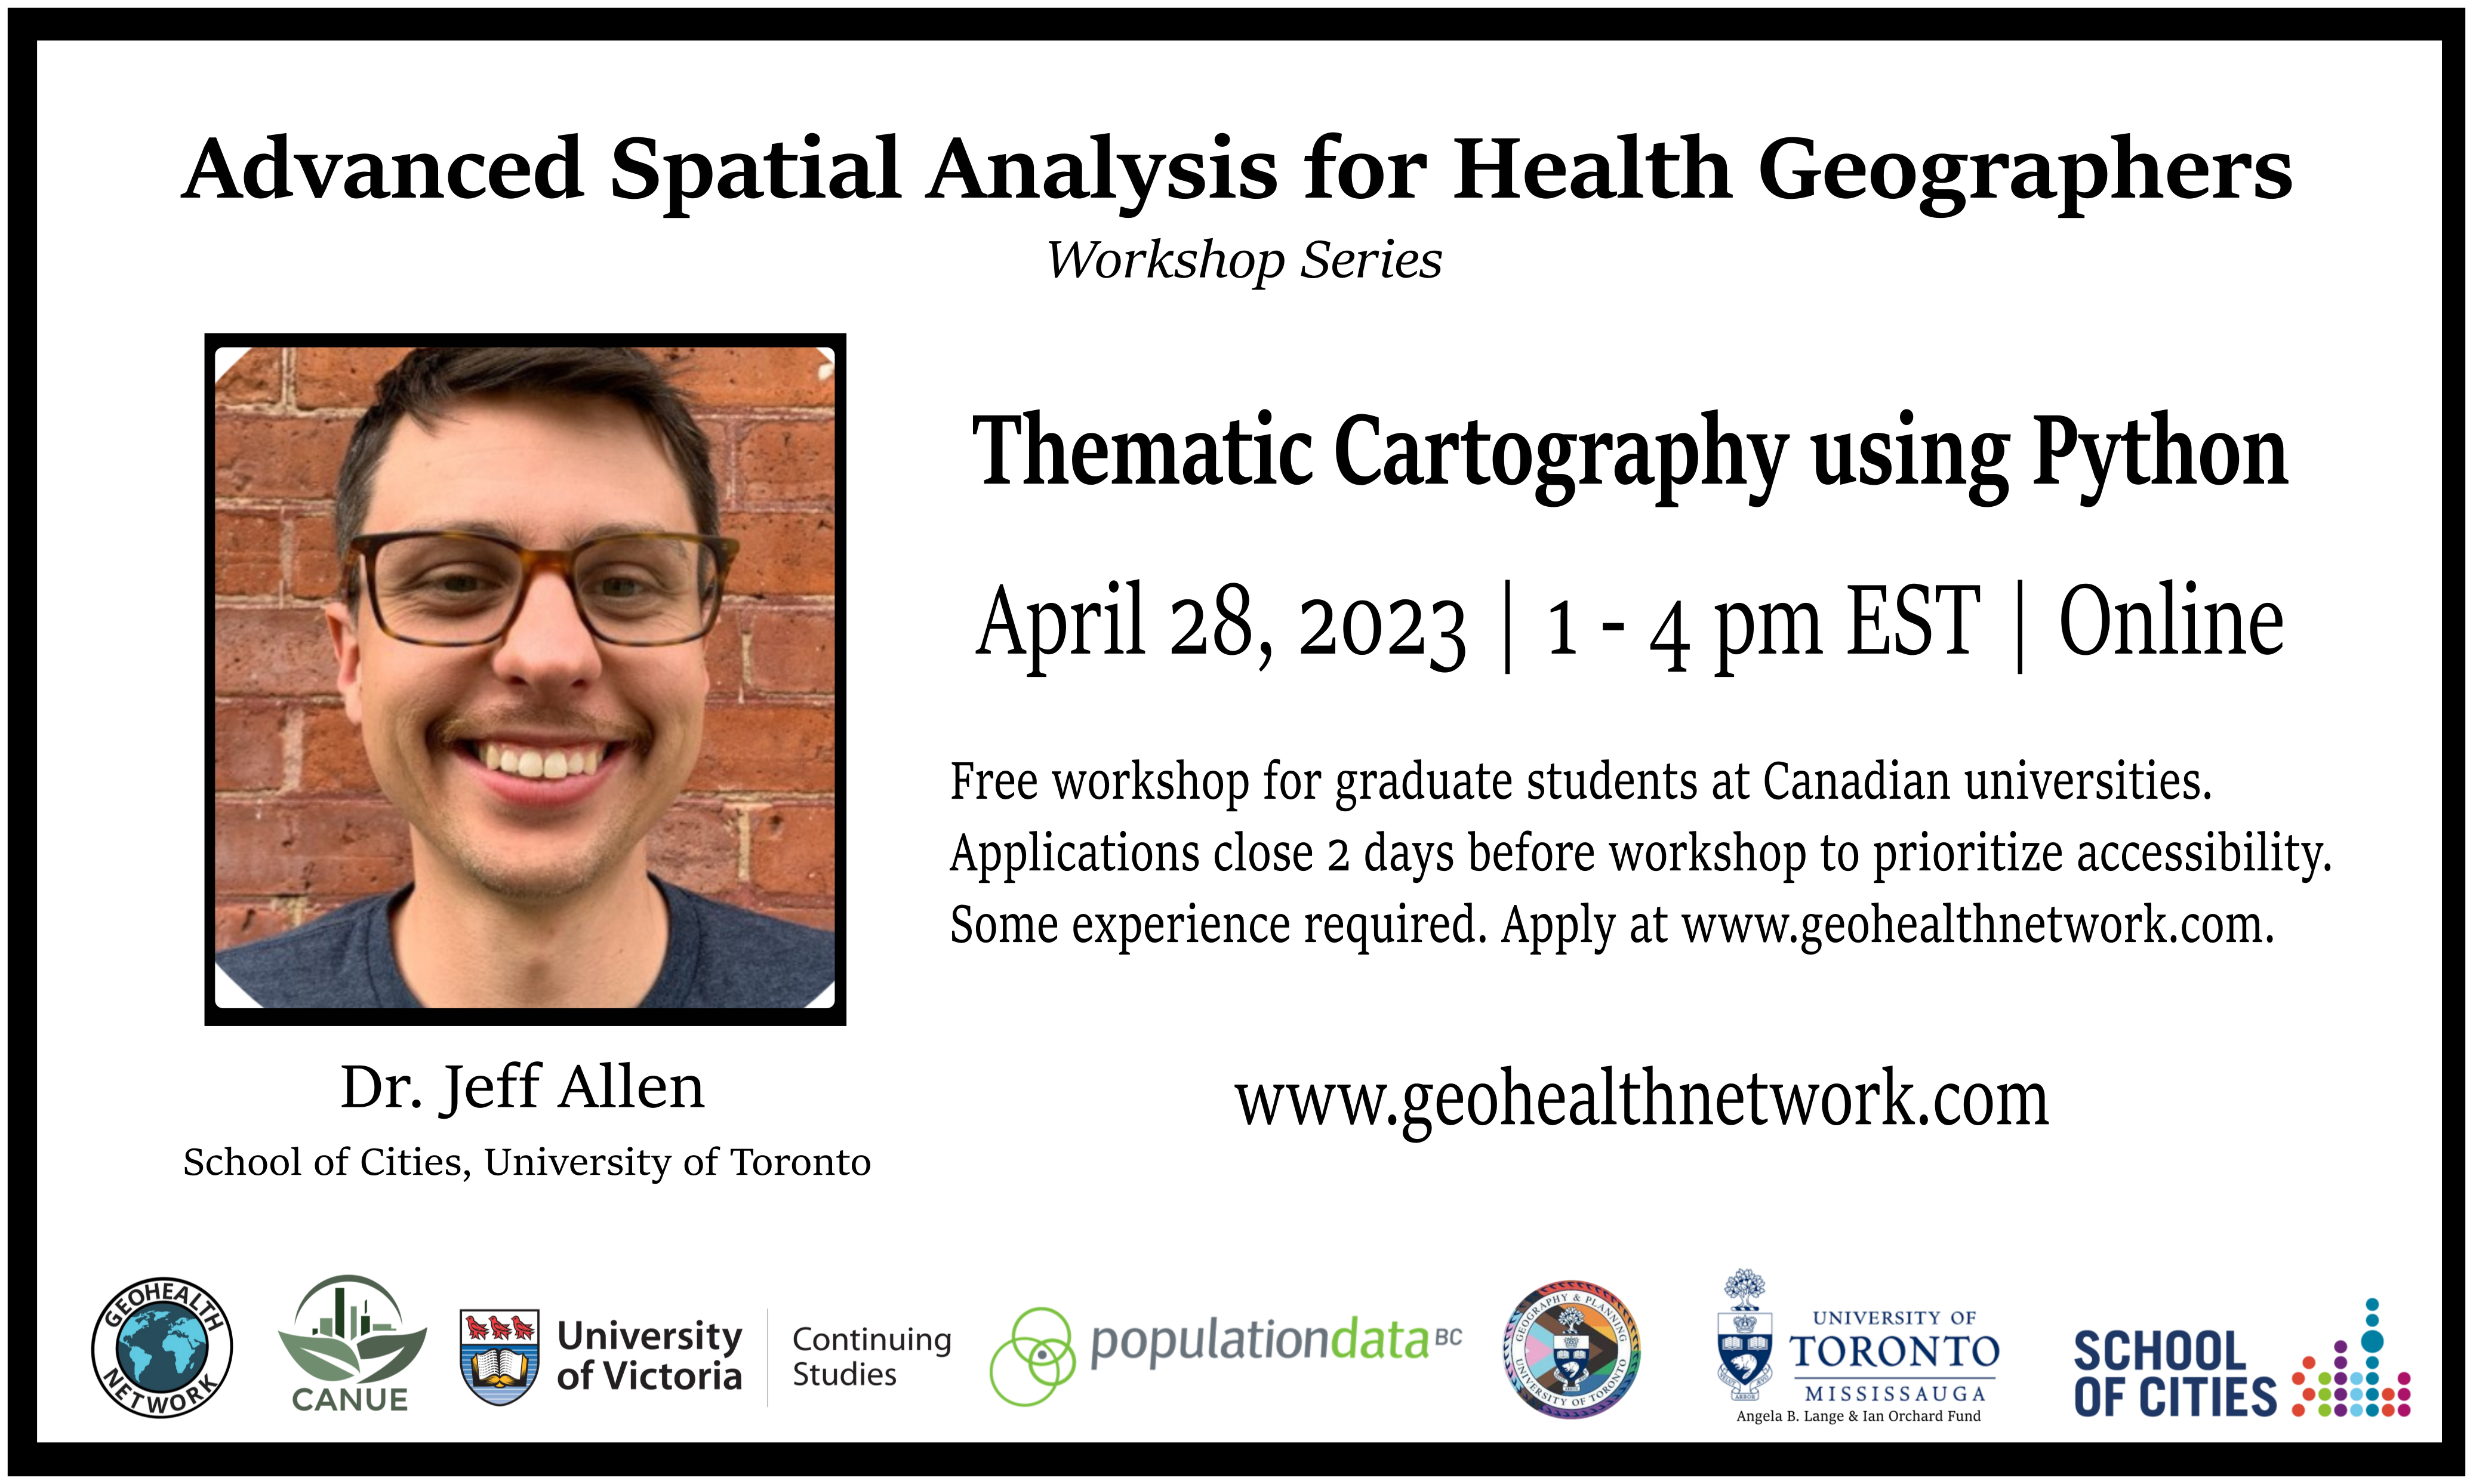
Maps can be great tools for exploratory analysis and communicating research findings. This workshop will cover intermediate-to-advanced thematic cartography aimed to help health geographers visualize their data. The first part of the workshop will provide general guidelines for designing better maps (symbology, layers and hierarchy, balance and alignment, and accessibility). We will then use Python and QGIS to create three types of thematic maps 1) dasymetric dot density maps 2) bivariate choropleth maps and 3) origin-destination flow maps. The final part of the workshop will introduce open-source graphic design software (Inkscape) to show how to create clear and effective map layouts based on visual design principles. We will also discuss how to best prepare and export maps for different types of publications, e.g. how to design maps specifically for journal articles, posters, presentation slides, public reports, websites, blog posts, etc. This workshop will use a provided dataset from CANUE and supplemental open datasets. Previous Introductory knowledge of Python and GIS Is recommended.
